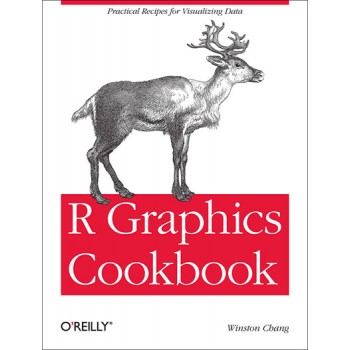
R Graphics Cookbook: Practical Recipes for Visualizing Data
ISBN 978-1449316952 Наличие: 1
| Издательство: | O'Reilly Media |
| Серия: | R (язык программирования), Бестселлеры O'Reilly |
| Размер: | 170x240 |
| Вес: | 750 |
| Переплет: | Мягкий |
| Язык: | Русский |
| Автор: | Winston Chang |
| Количество страниц: | 416 |
Описание
This practical guide provides more than 150 recipes to help you generate high-quality graphs quickly, without having to comb through all the details of R’s graphing systems. Each recipe tackles a specific problem with a solution you can apply to your own project, and includes a discussion of how and why the recipe works.
Most of the recipes use the ggplot2 package, a powerful and flexible way to make graphs in R. If you have a basic understanding of the R language, you’re ready to get started.
- Use R’s default graphics for quick exploration of data
- Create a variety of bar graphs, line graphs, and scatter plots
- Summarize data distributions with histograms, density curves, box plots, and other examples
- Provide annotations to help viewers interpret data
- Control the overall appearance of graphics
- Render data groups alongside each other for easy comparison
- Use colors in plots
- Create network graphs, heat maps, and 3D scatter plots
- Structure data for graphing

